
If you’ve ever stared at a CS2 skin on the Steam Market and thought “why is this worth that much?”, you’re not alone. CS2 skin prices can look random from the outside – one case-hardened AK-47 is cheap, another is a fortune, old cases slowly climb, and a random sticker suddenly spikes after a pro match. It feels chaotic, but the CS2 skin market runs on very real rules.
In this guide, we break down how CS2 skin prices actually form: supply and demand, Steam Market fees, case drops, rarity tiers, float values, patterns, stickers, and hype cycles around updates and tournaments. By the end, you’ll understand the logic behind CS2 skin prices and make smarter calls on when to buy, sell, or hold your skins.
If you’re buying or selling high-value items, pair this with the safety checklist in “How to Trade Skins Safely in CS2: A Step-by-Step Guide” to avoid scams and bad offers.
Contents
- 1 Market Mechanics: How CS2 Skin Prices Are Set
- 2 Supply vs Demand: The Core Driver of Skin Prices
- 3 Seasonality: When CS2 Skins Usually Dip or Spike
- 4 Updates & New Cases: The Biggest Price Catalysts
- 5 Rarity Tiers: The Price Floor for Every Skin
- 6 StatTrak™
- 7 Economic Factors: Liquidity, Volume & Volatility
- 8 Liquidity: How Fast You Can Sell Without Losing Value
- 9 Volume: How to Tell If a Price Is Real
- 10 Volatility: Why Some Skins Pump or Crash
- 11 Where Skin Prices Come From: Steam vs Cash Markets
- 12 Steam Community Market: The Baseline Reference
- 13 Third-Party API Aggregators: Blended “Fair Value” View
- 14 Price History & Chart Interpretation
- 15 CS2 Skin Price Forecasting Models
- 16 How to Read and Compare Marketplace Price Graphs
- 17 Risk Mitigation When Buying Skins in CS2
- 18 Why Prices Differ Across Markets (And What “Real Value” Means)
- 19 Key Takeaways: Buy Smarter, Sell Safer
- 20 FAQ: CS2 Skin Prices, Investing & Steam Fees
Market Mechanics: How CS2 Skin Prices Are Set

Every CS2 skin’s price is the result of multiple overlapping mechanics: item supply, trader demand, liquidity, case rotation, market fees, and behavioral trends. When these factors interact, they create the price movements you see on charts. In this section, we break down each component so you can understand the true underlying structure of CS2 skin pricing.
Supply vs Demand: The Core Driver of Skin Prices
At the core, CS2 skins follow the same basic rule as any other market: the more people want something, and the fewer copies exist, the higher the price goes.
- Supply comes from case openings, collection drops, operations, old stock held in inventories, and trade-ups (now including knife/glove trade-ups from Covert items).
In CS2 specifically, most new supply flows through the Weekly Care Package and the Armory Pass, which control how many new cases and collection skins enter the market each week/season. When a case is new and everyone’s opening it, supply floods the market, and most skins stay cheap. - Over time, fewer people open that case, some skins end up locked in inactive accounts, and the circulating supply effectively shrinks. That’s why old cases and rare skins usually trend upwards.
- Demand is driven by how “wanted” a skin is: clean design, popularity on social media, pro player usage, or simply fitting into popular color themes (white, red, gold, etc.).
- When demand spikes (a streamer uses the skin, a TikTok trend starts, or everyone suddenly wants a certain color-theme loadout) and supply doesn’t instantly adjust, you get short-term pumps.
In practice, most price moves are just supply and demand shifting around each other in slow motion — with occasional hype spikes on top.
Seasonality: When CS2 Skins Usually Dip or Spike
CS2 skin markets also have soft seasonal cycles, even if they’re not as obvious as in traditional finance.
- Holidays & big sales – Events like Steam sales or major holidays can cause extra market activity. Some people cash out to buy games; others load up on balance and buy skins on “sale” when listings temporarily dip.
- Summer & winter breaks – When more people have free time (school/university breaks), player counts go up, interest in skins rises, and demand often increases slightly.
- Post-event hangovers – After a big case release or operation, prices for older items may temporarily stagnate as everyone’s attention (and money) goes into the new content.
These patterns don’t guarantee profit, but if you’re planning bigger buys or sells, timing around high-activity periods can help you avoid selling the bottom or buying the top.
Updates & New Cases: The Biggest Price Catalysts
Big updates are the single most powerful catalyst for short-term price moves.
- New Case or Collection release – Players sell existing skins to get balance for new case openings – short-term dips in unrelated items. Hype around the new case skins – early overpriced listings that often correct after the first wave of openings.
- Changes to Drop Pools – When a case is moved out of the active drop pool or becomes “rare,” its long-term supply slows down, and both the case and its best skins usually trend up over time.
- Gameplay Balance changes – If a weapon becomes stronger or more meta, its skins can see demand spikes (e.g., when a rifle or pistol becomes the go-to pick). The opposite is true when a gun gets nerfed and falls out of the meta.
Any major patch is basically a stress test for prices. Traders who react too emotionally often panic-sell or FOMO-buy, while calmer players can use that volatility to enter or exit positions more smartly.
In October 2025, Valve expanded Trade Up Contracts so players could combine multiple Covert (red) skins into a knife or pair of gloves (or a StatTrak knife using only StatTrak reds). That update flooded the market with new knives and gloves, wiped huge chunks of value from many high-end pieces, and simultaneously sent the prices of certain cheap reds skyrocketing.
Rarity Tiers: The Price Floor for Every Skin
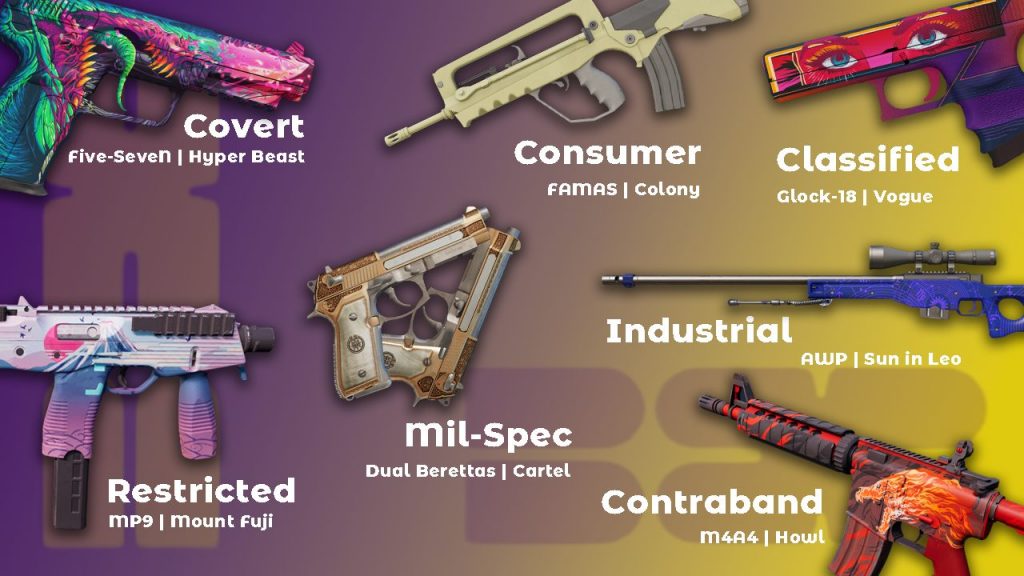
Every CS2 skin belongs to a rarity tier, and that tier heavily influences its baseline price — before we even talk about float, pattern, or stickers. The main classes (ignoring knives/gloves as a separate category) are:
| Rarity Tier | Color Code | Description |
|---|---|---|
| Consumer Grade | White | Very common |
| Industrial Grade | Light Blue | Uncommon |
| Mil-Spec Grade | Blue | Rare |
| Restricted | Purple | Mythical-tier skins |
| Classified | Pink | High-tier skins |
| Covert | Red | Ultra-rare (e.g. AK, AWP) |
| Contraband | Gold | M4A4 | Howl |
Rarity alone doesn’t guarantee high prices (an unattractive Covert can still flop), but it sets the floor and ceiling for what’s realistically possible. Combine rarity with old supply, meta relevance, good design, and hype — and that’s where you see the biggest long-term winners.
Float Value (0.00–1.00)
Float is a number that defines how worn a skin is. Lower float = cleaner look.
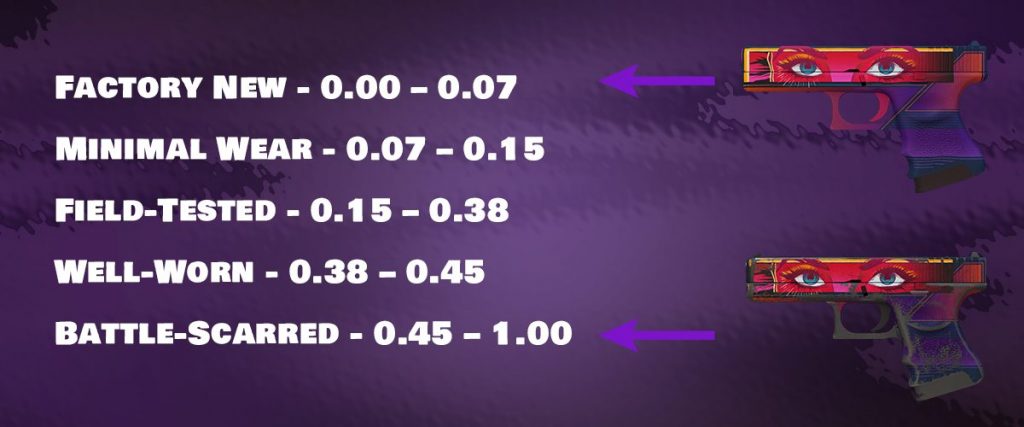
Float changes both visuals and price. On some skins, a Factory New can be several times more expensive than a Battle-Scarred version, and very low floats (0.00–0.02) often get extra “collector” premiums.
| Float Range | Wear Level | Description |
|---|---|---|
| 0.00 – 0.07 | Factory New | Pristine, minimal or no wear |
| 0.07 – 0.15 | Minimal Wear | Very light wear |
| 0.15 – 0.38 | Field-Tested | Noticeable wear but still clean |
| 0.38 – 0.45 | Well-Worn | Significant visible wear |
| 0.45 – 1.00 | Battle-Scarred | Heavily worn and scratched |
Big price jumps usually happen at the Factory New (FN) → Minimal Wear (MW) and Field-Tested (FT) → Well-Worn (WW) thresholds, especially on bright or clean designs (white, neon, gold), which look much worse as they wear compared to darker skins.
Float, wear tiers, and rare pattern IDs are a whole topic on their own, so we’ve broken them down in detail in our separate guide “CS2 Skin Float Value & Patterns: What Affects Price?”
StatTrak™

StatTrak™ is a kill counter built right into the skin. It registers kills in multiple official modes and shows how many kills you have made with this weapon. It looks cool and is valued above the regular version. These skins typically have a higher price than the standard versions of skins.
Pattern Index (0–999)
Each skin also has a pattern seed that controls the exact layout. Most patterns don’t matter, but some skins have chase patterns that are worth far more:
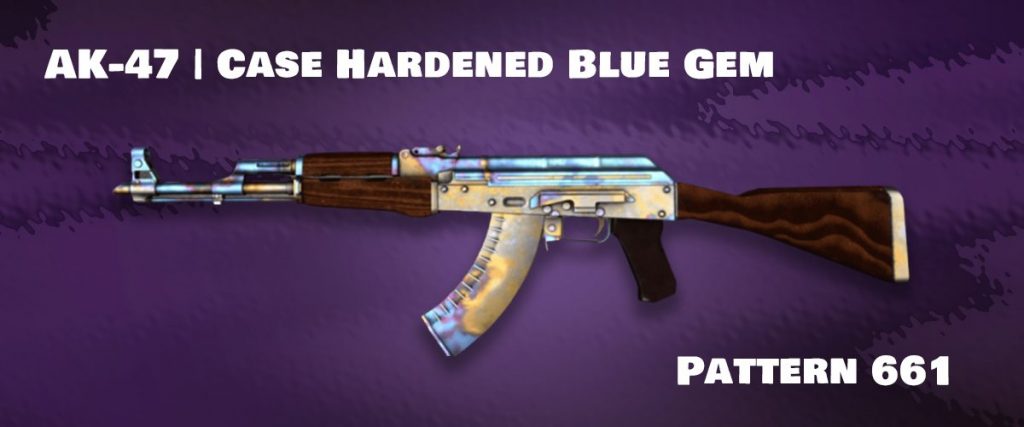
- AK-47 Case Hardened – blue gem patterns
- Doppler knives – Ruby, Sapphire, Emerald, Black Pearl
- Fade knives – high fade %, clean tip
- Slaughter / Web skins – specific web or heart layouts
Two skins with the same name and float can still differ by hundreds or thousands of dollars just because of their pattern.
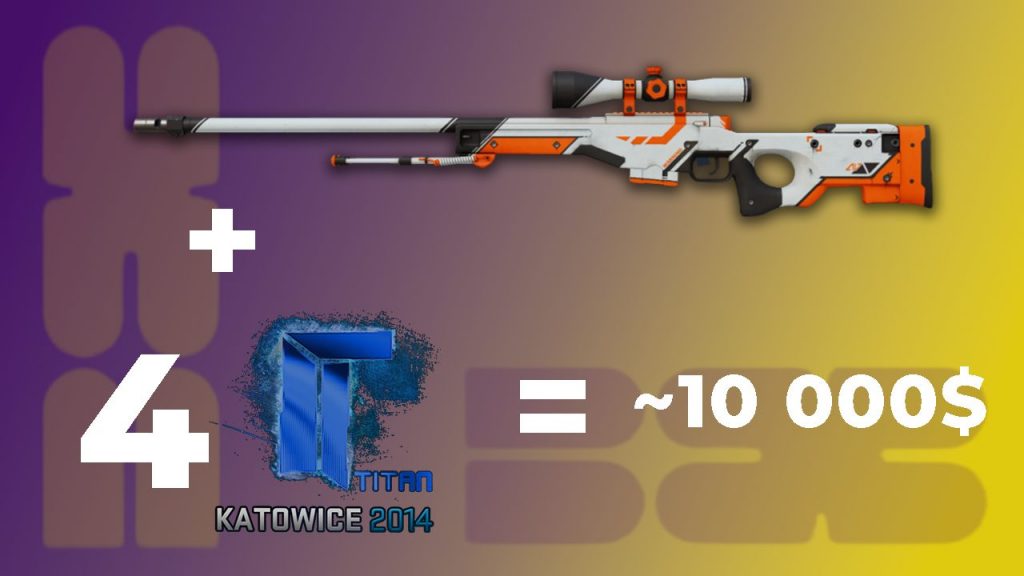
Stickers

Stickers can significantly raise prices, especially if they are rare or old, like Katowice 2014. Sometimes, the stickers themselves are more expensive than the skin itself. For more information about the stickers, see the article CS2 Stickers for Beginners: The Ultimate Guide.
Economic Factors: Liquidity, Volume & Volatility

Every item’s value is constantly pushed and pulled by supply, demand, case availability, update cycles, and how many people are actually buying or selling at any given moment. Understanding these mechanics is the key to knowing why prices rise, when they fall, and what actually drives long-term trends in the CS2 market.
Liquidity: How Fast You Can Sell Without Losing Value
Liquidity is basically how easy it is to buy or sell a skin at a fair price.
- A high-liquidity skin has tons of buyers and sellers. You can insta-sell it on Steam or a marketplace and only lose a small % vs the “market price”.
- A low-liquidity skin might look expensive on paper, but when you actually try to sell it, you either: wait days/weeks for a buyer, or have to undercut hard to move it.
Things that usually increase liquidity:
- Popular Weapons (AK, M4, AWP, Knives, Gloves, etc.)
- Popular Stickers (Paper, Holo, Foil etc.)
- Affordable price range (more buyers can afford it)
- Clean, broadly appealing designs (white/black/simple patterns)
For “investment” thinking, liquidity is huge: it doesn’t matter what a skin is “worth” if nobody’s actually willing to pay that price.
Volume: How to Tell If a Price Is Real

Trade volume is how many times a skin changes hands over a period (per day, week, month).
- High volume = the skin is actively traded, lots of daily listings and sales.
- Low volume = quiet market, where even small orders can move the price.
High-volume items usually give you more reliable price signals. When thousands of copies trade daily, the average price is a decent reflection of real demand. Low-volume items are easier to manipulate. A few high listings or faked sales can make a chart look like it’s “mooning” when in reality almost nobody is paying that price.
A good habit is to always check volume, not just price. A cheap, high-volume skin is often safer and more liquid than a “rare” low-volume meme item.
Volatility: Why Some Skins Pump or Crash
Price volatility is how much and how quickly a skin’s price moves up or down.
Low volatility skins move slowly – small changes over weeks or months:
- Older, established items.
- Highly liquid and high-volume.
- With steady, consistent demand.
High volatility skins can spike or crash in a matter of hours or days:
- New case skins right after release.
- Items affected by a patch, meta change, or big content creator.
- Low-volume items where a few trades swing the chart.
Volatility isn’t automatically good or bad:
- Traders who like to flip short-term often chase volatility for profit opportunities.
- People who care about stable long-term value usually prefer lower-volatility items from older cases/collections.
Liquidity + volume decide how hard it is to move the price. Volatility shows how often and how far the price actually moves.
Where Skin Prices Come From: Steam vs Cash Markets

When people say “this skin is worth X,” they’re almost always pulling that number from one of three places: Steam Community Market, Blix Stash, or third-party price aggregators. Each has a different role and a different level of accuracy depending on what you’re trying to do.
Steam Community Market: The Baseline Reference
The Steam Community Market (SCM) is the most visible and “official-feeling” source of CS2 skin prices because it’s directly integrated into Steam.
What it’s good for:
- True Steam balance price – This is what regular players actually pay when buying with wallet funds.
- High liquidity on popular items – Meta rifles, pistols, cheap skins, and active cases have constant buy/sell activity.
- Historical price graphs – You can see long-term trends, spikes during updates, and how stable (or unstable) an item has been.
Limitations:
- 15% fee – Buyers and sellers price items differently because of the fee, so SCM prices are usually higher than cash markets.
- No cash-out – You can’t withdraw funds, only spend within Steam. SCM value and “real money” value are not the same thing.
- Region & availability differences – Some regions interact differently with SCM vs 3rd-party sites, which can distort demand a bit.
How fees actually work for CS2 items:
- There is a Steam Transaction Fee of 5% (minimum $0.01).
- There is also a Counter-Strike 2 game-specific fee of 10%.
- Steam fees come out of the sale price: the buyer pays the listed total, and the seller receives the amount after Steam and CS2 fees are deducted.
So for CS2 items, the total marketplace fee is currently 15% (5% Steam + 10% CS2).
Third-Party API Aggregators: Blended “Fair Value” View
Third-party CS2 price aggregators are great for checking real-world cash value and cross-market pricing. They pull data from Steam and cash sites to give you a blended “average market price”, highlight arbitrage spots, and correct for Steam’s fee-inflated listings.
The downside is that they often lag, can include bad or fake listings, and usually ignore details like pattern, float, and stickers. Because they average everything together, that single price can hide a huge gap between low-end and high-end copies of the same skin.
Price History & Chart Interpretation
Price history shows if a CS2 skin is actually trending up, just moving sideways, or living off one random hype spike. Instead of staring at the current number, you want to read the chart: time on the X-axis, price on the Y-axis, and sometimes trade volume underneath.
A healthy uptrend usually looks like a slow staircase over weeks or months, with higher lows and steady volume. A bubble looks like a straight vertical spike and an equally ugly drop once hype fades. Over time, you’ll notice levels where price keeps bouncing from below (support) or gets rejected from above (resistance) – that’s where most trades cluster and where “fair value” sits.
Practically, buying near long-term support with stable volume and no obvious bad news is usually a lot safer than chasing an all-time high right after a big spike.
CS2 Skin Price Forecasting Models
Most CS2 “forecasting models” are just structured ways of guessing what happens next. Some traders use simple trend following: if a skin has been grinding up with steady volume and no crazy spikes, they assume that slow climb continues unless a big update hits. Others think in events – new cases, operations, Majors, or drop-pool changes tend to cause similar short-term moves to past updates.
People also forecast from basic supply and demand. Old or discontinued cases with shrinking supply are expected to drift up over time, while heavily opened cases are seen as flatter. Hype sits on top of this: popular weapons, clean designs, and pro or streamer usage make traders more confident that demand sticks around. Finally, many decisions just come down to support and resistance: prices near an old “floor” feel like safer entries, while all-time highs or known “ceilings” are treated as much riskier spots to buy.
How to Read and Compare Marketplace Price Graphs
When you open a marketplace price graph, start simple: time on the X-axis, price on the Y-axis. Zoom out to a few months at least so you don’t overreact to one spike. Look for the overall trend – is the skin grinding up, moving sideways, or slowly bleeding down – and where most recent trades are clustering. That cluster is your real fair value range.

Ignore single candles that sit way above or below everything else on tiny volume. Those are usually outliers or manipulated trades, not the true market price.
When you compare Steam graphs to third-party sites, remember they reflect different realities. Steam bakes in the ~15% fee and wallet-only balance, so prices look higher and smoother. Cash markets sit lower and often look more volatile, but they’re closer to real money value. A slow uptrend on Steam with a choppier but similar range on a third-party site is normal. If one graph looks calm and the other is spiking like crazy with low volume and no news or updates behind it, treat the crazy one as a suspect.
Risk Mitigation When Buying Skins in CS2
Risk mitigation is just making sure one bad buy doesn’t nuke your balance. Only spend money you’re fine holding in skins long-term, not anything you actually need.
Before buying anything pricey, check multiple markets (Steam + at least one cash site), skim recent price history, and make sure there’s real volume – low-liquidity items are harder to exit. Prioritize popular, liquid skins over ultra-niche gambles.

Be extra careful with hype. If a skin just pumped because a pro used it or a YouTuber showcased it, assume you’re late and double-check float, pattern, and stickers so you don’t overpay. Stick to trusted marketplaces, ignore “too good to be true” off-site offers, and never rush because someone is spamming you to go fast. Slow down, compare prices, and always ask: how easily could I resell this tomorrow?
Why Prices Differ Across Markets (And What “Real Value” Means)
Cross-market price discrepancies are basically the gaps between what the same skin “costs” on different platforms: Steam, third-party markets, P2P, buff-style sites, etc. Steam usually shows the highest prices because of the 15% fee and the fact you’re dealing with wallet balance, not cash. Cash markets tend to sit lower because buyers pay real money and expect a discount, while sellers accept less in exchange for being able to withdraw.
Regional demand, site fees, bots, and how many traders actually use a platform all shift prices a bit, so the “true” value of a skin lives somewhere between these numbers. Traders try to exploit those gaps (buy cheaper on one, sell higher on another), but for normal users it’s enough to understand that one screenshot of a Steam listing doesn’t tell the full story of what that item is really worth in cash.
Key Takeaways: Buy Smarter, Sell Safer
CS2 skin prices are ultimately driven by supply, demand, rarity, float, patterns, stickers, and marketplace fees. When you understand how these factors interact — from update-driven hype spikes to long-term scarcity trends — it becomes much easier to evaluate whether a skin is overpriced, underpriced, or sitting at a stable market value.
For smarter buying, always compare Steam vs. third-party prices, check float/pattern premiums, and review recent sales rather than only listed prices. For selling, consider timing around updates, case drops, seasonal volatility, and liquidity, since these can significantly shift how quickly skins move.
FAQ: CS2 Skin Prices, Investing & Steam Fees
Why do CS2 skin prices change so often?
Prices move because supply and demand constantly shift—case openings slow down, player interest rises, or hype from updates and creators temporarily spikes demand. Even small changes in activity can cause noticeable price swings.
Do float values really affect a skin’s price?
Yes—lower floats, rare patterns, and clean wear levels can raise a skin’s value significantly. Two skins with the same name can sell for wildly different prices if their floats differ.
Is buying skins after a new case release smart?
Usually not—new skins are overpriced in the first days because supply is low and hype is high. Prices typically stabilize or drop once more players open the case, and the market fills.
Why are some old skins so expensive?
Older skins often rise because the cases that dropped them are discontinued, meaning supply shrinks every year. When demand stays strong, the price naturally climbs.
Are third-party prices more accurate than Steam?
Steam prices are inflated by the 15% fee, while third-party markets reflect closer-to-cash values. Comparing both gives a more realistic picture of what a skin is actually worth.