
Traditional sports has grown over the years in terms of analytical data that you can fetch or use to analyze various factors leading to a team’s win or a player’s performance. One such aspect of its use-case is to calculate consistency.
Contents
Introduction
It is easier to look at it from an observer’s point of view and assess who plays well on a constant basis than to do it analytically with numbers. That is why in sports like soccer we have various new statistics like xG (Expected Goals), PPG (Points Per Game) and other rolling averages. All these metrics use some sort of prediction model based on statistical measures such as Standard Deviation or Coefficient of Variation (CV).
For our line of work, we will be using the VLR Rating over ACS. That is because VLR’s rating system ends up being more holistic and more in use than ACS which tends to over-value certain KPIs such as First Kills. This leads to certain roles/agents being favored towards having a higher ACS score.
Moving forward in this article I will address VLR Rating as “R2.0” to avoid any confusion and save time.
Statistical Measures
Let’s recap a bit of mathematical statistics to understand what we are actually trying to do here. It might seem rudimentary but its important to clear these concepts.
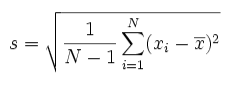
Standard Deviation: It is used to show variability in a dataset or simply how much a variable in a dataset fluctuates. To calculate the standard deviation of a performance metric (R2.0 in our case) is to quantify its variability. A lower standard deviation indicates higher consistency. The statistical formula for it is shown below.
Where:
- s = sample standard deviation
- N = number of observations in the sample
- xi = each individual observation
- xˉ = sample mean (average of the sample observations)
Coefficient of Variation (CV): This is the ratio of the standard deviation to the average. It provides a standardized measure of consistency, allowing comparisons across different metrics or players.
Measuring Consistency
The first step towards measuring consistency is to find the R2.0 for every map played for every player. I want to emphasize here: every map not every match. The reason being that a match is usually either a Bo3 or a Bo5 and hence the ratings are averaged across the maps for the end result. We need to avoid this averaging of the data and need to take the R2.0 directly from the map. The finer our data the better the end result will be.
For this we will actually reference the 2017 article from PMA on the same topic but for CS: Global Offensive. The article is titled “Consistency of CS:GO players throughout 2016”. The article serves as a great starting point as we dive deeper into this topic.
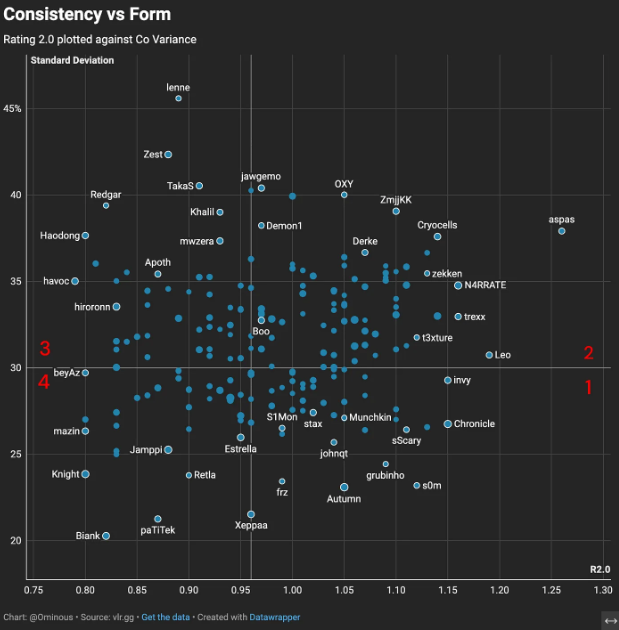
I have plotted a similar chart as PMA’s using the 2024 VCT data. I have labeled the four quadrants in red that are formed from the averaging lines. Each of the four quadrants mean something.
- 1 : High Consistency High R2.0
- 2 : High Inconsistency High R2.0
- 3 : High Inconsistency Low R2.0
- 4 : High Consistency Low R2.0
The problem we run into is identical to the one PMA ran into for CS:GO but probably far worse for VALORANT. That is because VALORANT has different agents and roles, each role has its own set of averages.
I would like to introduce you to the concept of floor and ceiling to better understand the problem at hand. I will also link the 2024 VCT Player Statistics Database.
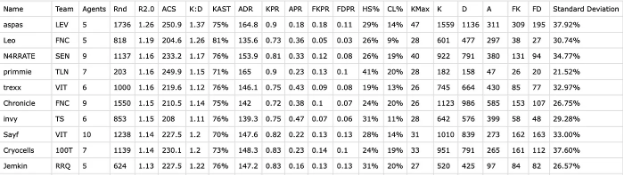
Take aspas for example, he was the highest rated player in 2024 in terms for R2.0 with a Standard Deviation of 38%. This means aspas had a very high ceiling and high floor in 2024 in terms of R2.0 since his rating fluctuated so much at 38% inconsistency along with a R2.0 score of 1.26.
Now let’s take a look at Munchkin from Gen.G, he finished the year with a R2.0 of 1.05 with a Standard Deviation of 27%. That is remarkable consistency, much better than aspas. But due to Munchkin’s R2.0 being only 1.05 his ceiling isn’t that high and his floor is quite low as well.
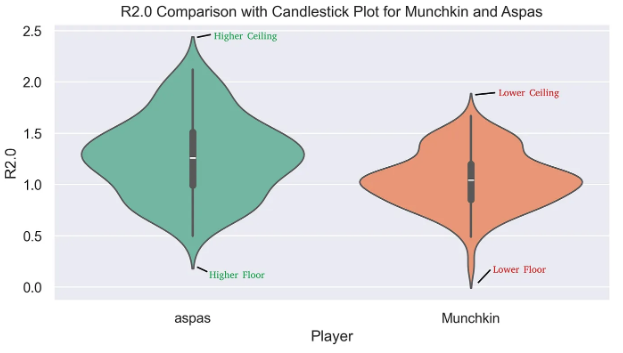
The whole problem arises due to VALORANT having different agent classes. The roles and number of agents that Munchkin plays makes it very hard for him to push his ceiling higher on a consistent basis.
So to conclude, having a lower standard deviation does not necessarily always show the full picture and Coefficient Variance (CV) would have to be optimized in order to fit VALORANT since each role has a different average.
Optimizing the solution
To find the right balance I have decided to optimize the Coefficient of Variance (CV) but with a bit of a twist. First and foremost, we need to classify the Averages based on agents played by a particular player.
The whole idea is to move the averages based on the agents a player has played. By doing so we are adjusting the floor and ceiling for the player based on the agent he has played.
Once we have done that we find something called Games Above Adjusted Average (GAA). We do that by finding all games a player has finished with a R2.0 higher than the average R2.0 of the agent he played during those games. Finally we take those number of games and divide it by the total number of games he has played with that agent.
Above is the python script I wrote to generate these ratings. You can download the VCT 2024 dataset that I have mentioned above and use this script to generate these numbers yourself.
By doing so, we are creating an even playing field for every player irrespective of their roles on the team. This also helps the KPIs keep up with the current meta.
“GAA ensures that as the meta changes, and while a particular agent’s pick-rate may increase or decrease, so will our dynamic average along with it.”
The results were surprising to say the least. Leo clocked in a GAA score of 0.735. In other words, in 3 out of 4 games that Leo played in 2024 he ended up having a R2.0 higher than that agent’s average R2.0 Rating. It is a crazy statistic if you think about it. It is even crazier for a player like aspas to have a score of 0.729 if you think about the number of games he has played in 2024.
Polishing the results
Finally, it is time to add the final touch. Like I said in the beginning we are working our way around Coefficient of Variance (CV). So, we have our dynamic mean in the form of GAA. Now we simply multiply it with Standard Deviation. The result would give us something that I call Consistency Index.
- Consistency Index = GAA x std dev(R2.0)
By incorporating standard deviation, the method accounts for variability, helping to differentiate between consistently high performers and those with sporadic good games.
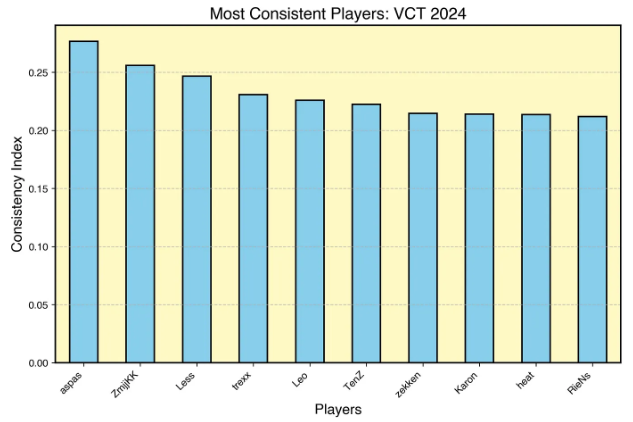
Finally, I leave you with the results of my work for the VCT 2024 season. The most consistent player for the year according to my rating system was aspas. He was followed by the current world champion ZmjjKK with Less coming in at third. A huge shoutout also to Karon for having an incredible debut year.
The dataset includes every match played in the 2024 season barring Masters Shanghai and the regional matches of VCT CN.